

Municipal infrastructure doesn’t sit tidily in one building. It’s spread across every street, park, and right-of-way in the community, buried under roads and stretched across kilometres of pipe. That’s exactly what makes trying to manage it with a spreadsheet so frustrating.
A spreadsheet can tell you “Watermain, Asset 1045.” It can’t tell you where Asset 1045 runs, what it connects to, which valves shut it off, or what else is buried alongside it. A map can. That gap is the whole case for GIS for municipal asset management, which brings spatial and tabular information together in one environment instead of keeping location and records in separate worlds.
The map also enables you to confirm pipe lengths, whether there are duplicate assets, whether you have accounted for all buildings, fire hydrants, signs, and culverts in the real world.
This guide covers what the approach involves, which assets it can handle, how field crews keep it current, and how to roll it out without getting overwhelmed.
What is GIS Asset Management?
It’s tempting to picture GIS as just objects on a map. GIS asset management goes well beyond that. It combines spatial data, the records attached to each asset, the workflows that keep both current, and the analysis that turns all of it into decisions. The map is the visible layer, but the real value comes from everything working together underneath it.
Think of it as linking the “where” of an asset to the “what.” One click on a pipe reveals its age, material, condition, and repair history, with no separate file to dig through. That connection between location and data is something a plain table can never give you.
Why Mapping Changes, the Way Municipalities Work
The benefits of GIS for municipal asset management show up fast once assets have a place on the map. Here’s where staff feel the difference day to day.
- See the Whole Network
Instead of reading rows, staff can take in an entire water or road network at a glance, color-coded by condition or age. Patterns that hide in a spreadsheet jump straight out on a map.
- Find Any Asset in Seconds
Locating a hydrant or a culvert becomes a click rather than a scroll through thousands of rows. When a main breaks at 2 a.m., that speed genuinely matters.
- Connect Location to Records
Every asset carries its full record with it, so position and information never drift out of sync. Update one, and the other stays current.
- Support Field Data Collection
Crews can capture and update assets on site rather than scribbling notes to type up later. The record gets better right at the source.
- Improve Infrastructure Planning
Seeing assets in context, next to the roads and properties they serve, makes it far easier to coordinate projects and avoid tearing up the same street twice in two years.
- Strengthen Your Asset Plans
Because provinces increasingly expect condition and location data in asset plans, mapped records make meeting requirements like Ontario’s O. Reg. 588/17 much less painful.
Which Municipal Assets GIS Can Handle
Almost anything a community owns can live in a mapped system. Good municipal infrastructure mapping usually reaches across several asset groups at once, not just the obvious ones.
Roads
The most visible group, and it covers more than pavement:
- Road surfaces
- Signs
- Culverts
- Barriers
- Bridges
Water
Distribution components like mains, valves, and hydrants, along with treatment and plant components. Since most of the network is buried, the map is often the clearest view staff have.

Wastewater
Collection components, such as sewers and manholes, plus the plant components that treat what they carry.
Buildings
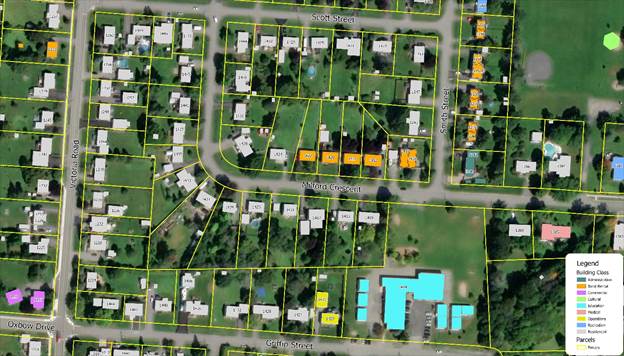
Building and unit footprints, civic addresses, and for rural properties, features like septic systems, wells, and fuel storage that are easy to lose track of otherwise.
Parcels
Boundaries, the legal land inventory, and the unique IDs that tie every other asset back to a property.
Fleet
Vehicle and equipment inventory, connected to the yards and routes each unit works from.
What Data Should a Municipal GIS Asset System Contain?
Every mapped system runs on two data types working together, and getting both right is the core of solid spatial asset management. Miss either one, and the system only tells half of the story.
Spatial Data
This is the geometry, the shapes, and positions that place each asset in the real world:
- Points
- Lines
- Polygons
- Coordinates
- Boundaries
- Locations
A hydrant is a point, a watermain is a line, a building is a polygon.
Tabular Data
This is everything you’d want to know once you’ve found the asset:
- Asset IDs
- Condition
- Ownership
- Installation date
- Life expectancy
- Maintenance history
- Cost
- Inspection data
On its own it’s just a table. Joined to the geometry, it becomes a living record. Canyon Logics builds its work around exactly this pairing of spatial and tabular information, because one without the other leaves you guessing.
How GIS Supports Municipal Field Data Collection?
A map is only ever as good as the data feeding it, and keeping it fed is a core part of GIS data management. Much of that data starts out in the field, not at a desk.
With a phone or tablet, crews can verify an asset’s location, run inspections, record condition assessments, capture brand-new assets, push updates, and attach photos right where they’re standing. Every entry flows straight back into the central system, so the office works from today’s reality instead of last year’s.
Field workflows are a big enough topic to stand on their own, and we go deeper in our guide on GIS Field Data Collection for Municipalities.
GIS as the Backbone of Your Inventory
An asset inventory answers the question of what a community owns, while a map answers where each item actually sits. Bring them together, and a GIS asset inventory becomes the spatial half of that record, giving every line a real position on the ground rather than a vague note in a cell. The inventory stops being a static list and turns into something crews can see, query, and trust.
If you’re still assembling that underlying record, it’s worth getting the structure right before you map anything. Our guide to building a Municipal Asset Inventory covers the fields and standards to start with.
Feeding Better Asset Management Plans
All this accurate spatial and tabular data isn’t an end in itself. It exists to support better decisions, and nowhere is that clearer than in long-term planning. Clean records feed straight into inventory counts, condition ratings, risk scoring, lifecycle forecasts, maintenance schedules, and the investment decisions that flow from them.
A map-based foundation makes the whole cycle of Municipal Asset Management more reliable, since a plan is only ever as trustworthy as the data sitting underneath it.
What You Gain From a Map-Based Approach
Pulling it all together, a well-run municipal GIS delivers a set of practical gains that compound over time:
- Centralized asset information in one place
- Better visibility across departments
- Smoother field workflows
- More accurate asset records
- Faster data retrieval
- Stronger long-term planning
- Cleaner reporting
- Sharper infrastructure decisions
For many communities, the biggest shift is cultural. Once staff trusts the map, they stop keeping private spreadsheets, and the whole organization finally works from one shared picture.
Common Challenges When Implementing GIS for Municipal Asset Management
None of this happens automatically, and it’s worth being honest about the hurdles. Most projects stumble over the same handful of issues:
- Legacy data trapped in old formats
- Inconsistent standards between departments
- Incomplete inventories with real gaps
- Outdated information that nobody has refreshed
- Limited staff capacity, standards and procedures to maintain and run the system
- Staff changes
- Changing priorities and urgencies
- Technology and licensing costs
- Disconnected systems that don’t share data
- Missing procedures for updates
- Not enough training
The common thread is that software alone fixes none of them. Success leans on standards, procedures, and people as much as technology, which is exactly where an experienced implementation partner makes the difference.
How to Implement GIS for Municipal Asset Management
A staged rollout keeps the work manageable and avoids the all-or-nothing trap. A dependable path looks like this:
- Assess the current environment: Understand the data, systems, and resource capacity you already have.
- Identify functional requirements: Decide what the system needs to do for each department.
- Define data standards: Set naming, IDs, and formats before any data goes in.
- Establish the technology environment: Sort out software, licensing, hosting, and backups.
- Build or clean the asset database: Consolidate existing records and fix what’s broken.
- Configure field and desktop workflows: Set up how staff will collect and use the data.
- Train staff and set up ongoing support: Make sure the system survives turnover and keeps running.
Followed in this order, a rollout of GIS for municipal asset management delivers value at every stage instead of asking the community to wait years for a payoff.
How Canyon Logics Supports Your GIS Program
This is the work Canyon Logics does with municipalities every day, and it lines up closely with the steps above. Rather than handing over a system and walking away, we stay involved as an ongoing partner. Our support covers the whole journey:
- Current-environment assessments
- Needs assessments
- Operational resource and technology support
- Implementation planning
- Technology environment setup
- Field data collection tools
- Spatial and tabular data capture
- Custom applications
- Reporting
- Standards and procedures
- Training
- That end-to-end involvement is what makes GIS for municipal asset management sustainable rather than a one-time project. The system keeps working after the initial setup because the people, standards, and support around it don’t disappear once the first phase wraps.
To see how that plays out for a smaller community, explore Canyon Logics’ Municipal Asset Management Services and how the subscription model enables you to provide support to your current resources and keep your data and maps current on an on-going basis built into day-to-day operations.
Frequently Asked Questions
What does GIS bring to municipal asset management?
GIS for municipal asset management combines mapped locations with asset records, so staff can see where every asset is, what condition it’s in, and what it connects to, all in one place instead of across scattered files.
Is GIS really better than a spreadsheet?
It depends on your needs, data maturity, and resources. A small, clean spreadsheet can be enough for a modest portfolio, but once you’re managing thousands of buried or spread-out assets, a map-based system quickly pulls ahead.
Which municipal assets can go into a GIS?
Roads and bridges, water and wastewater networks, buildings and facilities, fleet, and the parcels and property records that anchor everything to a location.
How does GIS help with field data?
Crews use phones or tablets to verify locations, log inspections, record condition, capture new assets, and attach photos on site, with every update flowing back to the central system automatically.
How do we get started?
Begin with a staged rollout of GIS for municipal asset management: assess what you have, set standards, clean up the data, then layer in field workflows and training rather than trying to do everything at once.